







See the gap between what’s in the charts and what your documentation captures.
Two-week studies that uncover the complexity trapped in any chart.
The Evidently Silent Study methodology is a two-week process of analyzing a sample of patient charts with the Admit Note Silent Study and HCC Silent Study. Each study provides a no-commitment way to quantify the value trapped in the chart for inpatient and value-based care settings.
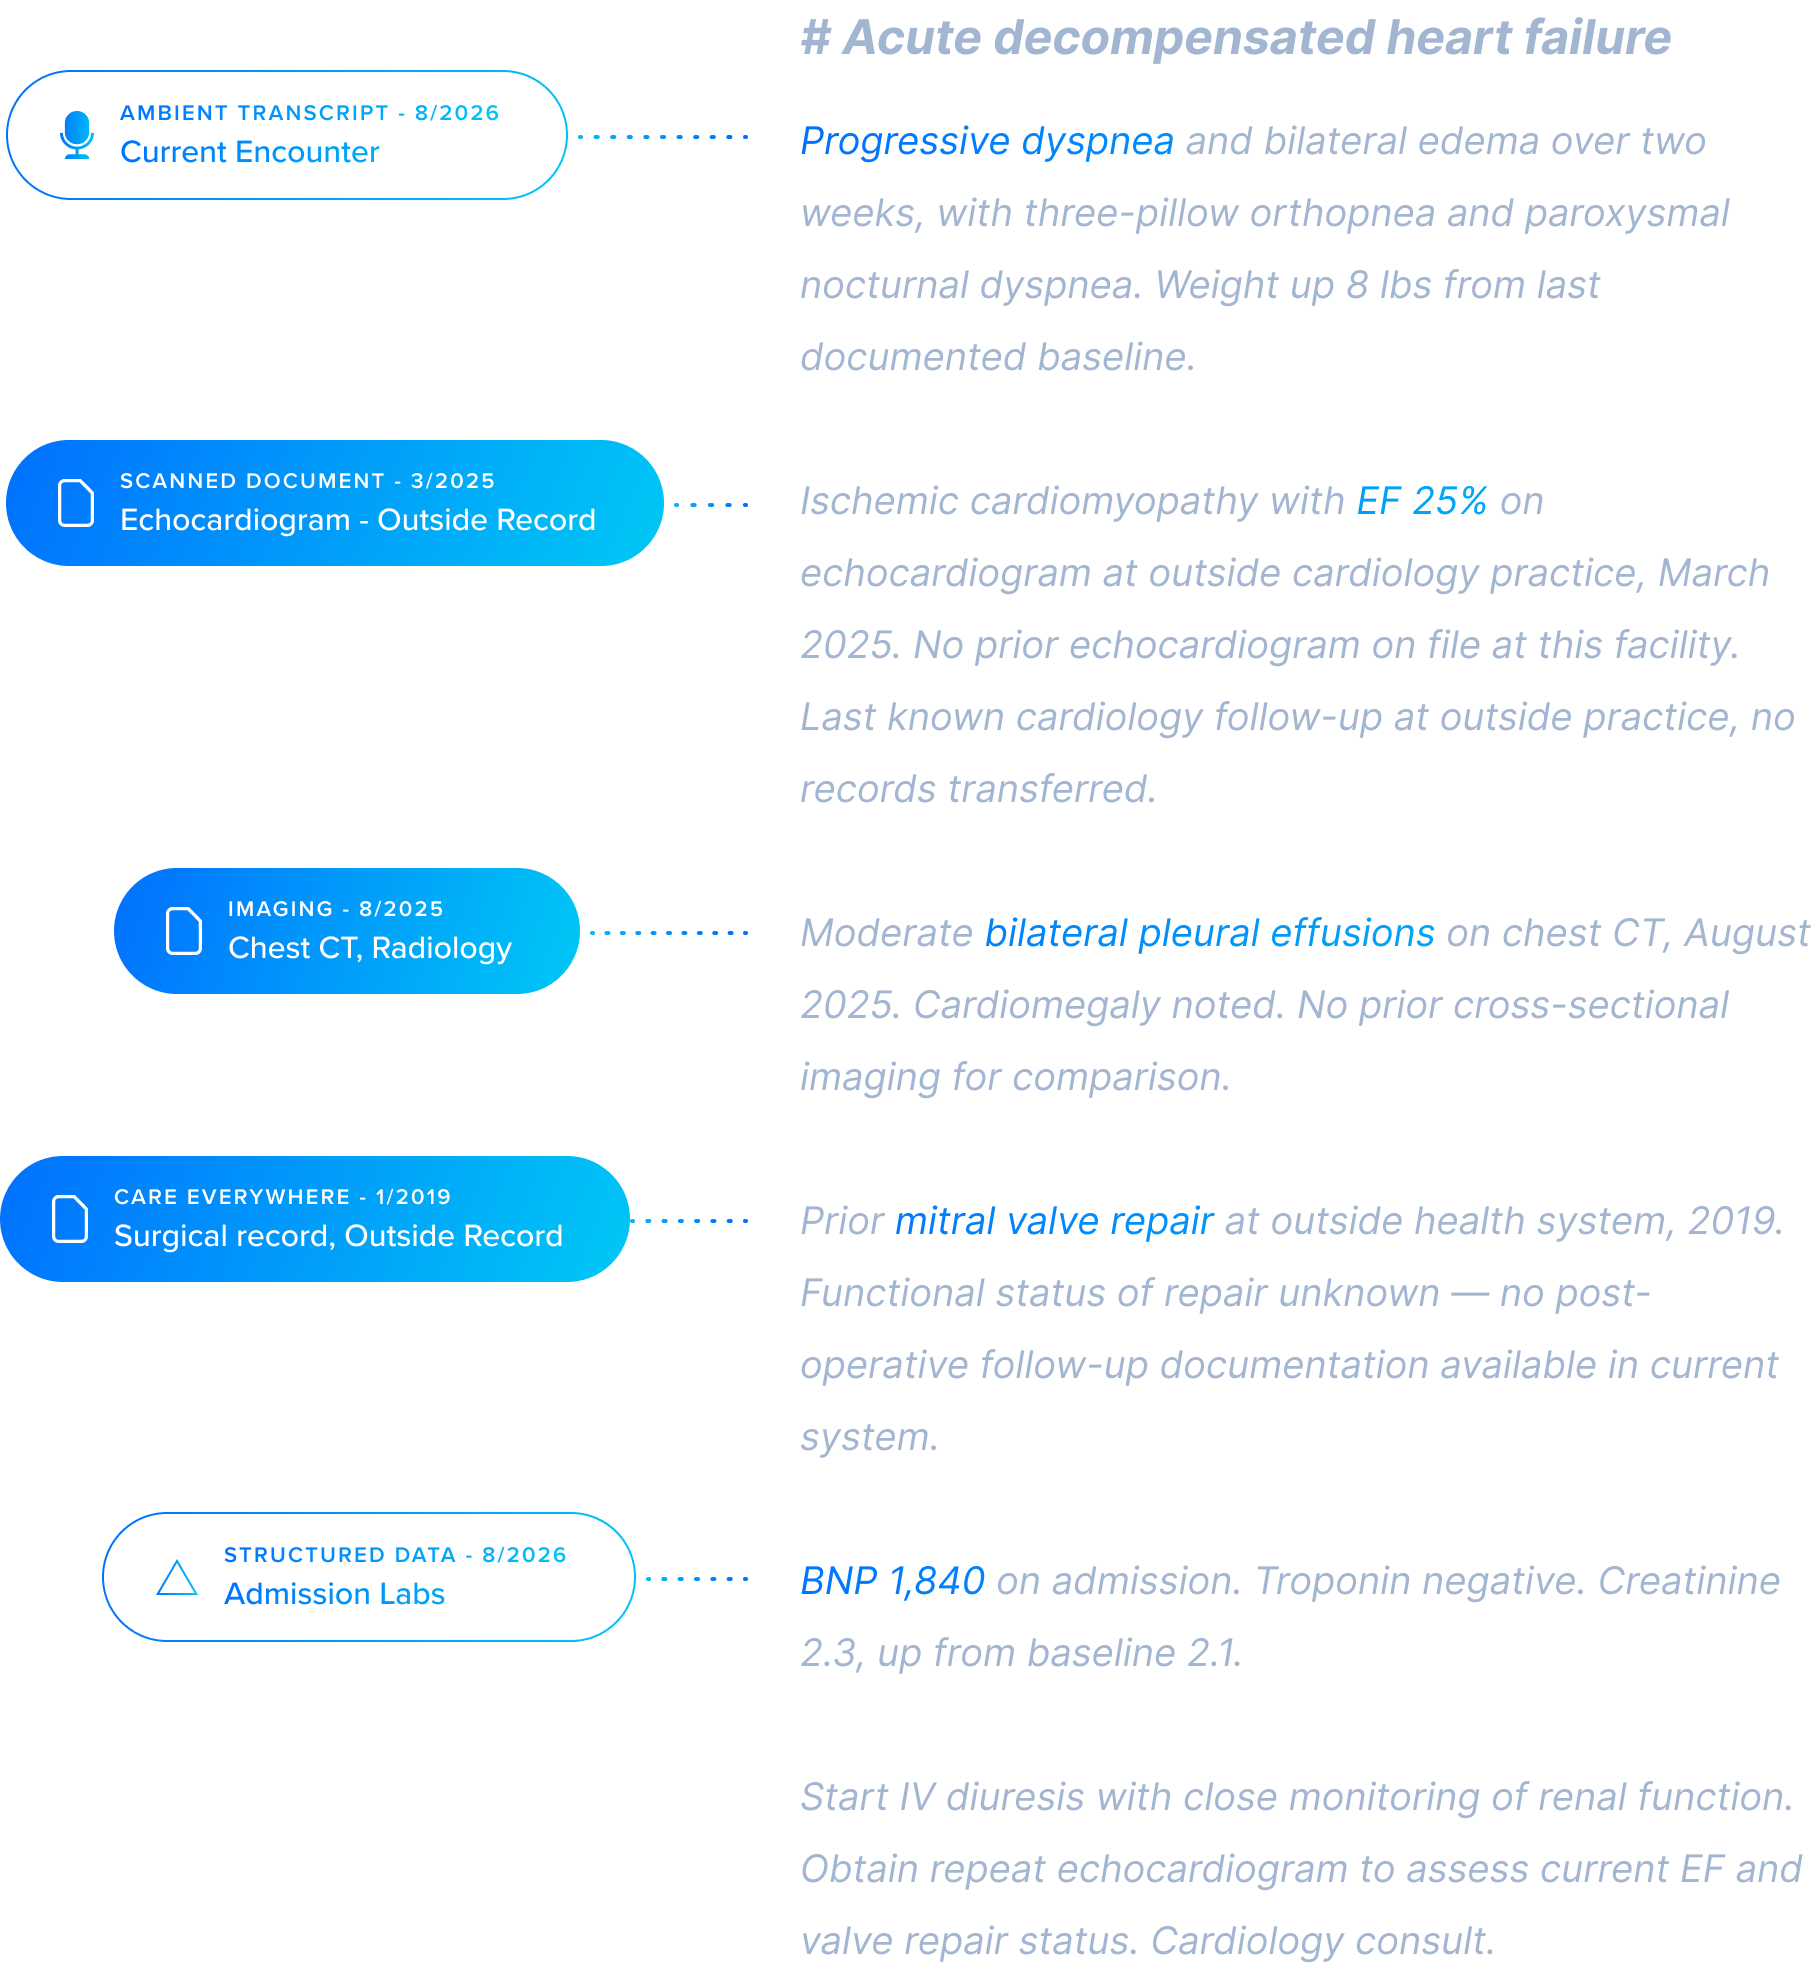
Massive value is trapped in the patient chart, in both revenue production and care delivery. Evidently reads everything in the chart and maps it to a medical knowledge graph, creating a real-time picture of full longitudinal complexity.
For Inpatient Complexity Capture
The Admit Note Silent Study: quantify the quality-impacting conditions your admit notes are missing, and the impact on mortality benchmarking and CMI.
The admit note sets the picture for the whole stay. Care decisions, CDI review, coding, Case Mix Index, and mortality benchmarking all start from it.
But the complexity that belongs in it is often trapped in the chart, buried in outside records, scanned documents, and years of history no one has time to read at admission. The study drafts an admit note for each patient from the full record and sets it beside the one your provider wrote, so you see exactly which conditions never made it in. Get started today

See how the University of Iowa Health Care found net-new quality-impacting conditions in 95% of charts, in peer-reviewed research published in Applied Clinical Informatics.

See how UnityPoint Health found an average of 4-5 net-new quality-impacting conditions per admit note, and a projected CMI increase of at least 0.06.

See how UNC Health found an average of 3–4 additional quality-impacting conditions per chart
For Value-Based Care
The HCC Silent Study: quantify the conditions your coding hasn’t captured, and the impact on risk adjustment.
In outpatient care, the gap works differently. Risk adjustment resets every year: a condition counts only if it’s documented and coded this year, at the specific stage, in documentation with MEAT criteria.
That evidence is often already buried in the chart, in specialist notes, labs, imaging, and last year’s visits that never carried forward. The study reads each patient’s full record and checks it against your problem list and claims, so you see which HCCs are missing, what they mean for RAF, and the MEAT evidence behind each one, which supports audit readiness. Get started today
40%
On average, the HCC Silent Study observes 40% more HCC conditions supported by the chart than were captured.
~1/2
About half of patients had at least one HCC the chart supports that coding had not captured
25%
On average in HCC Silent Studies about one-quarter of the risk the chart supports was missing from the coded picture.

We have a patient that’s coming up for a visit in the future. We know conditions that are being identified for review, we created a Skill that pulls everything together for a given condition. All that manual review that was taking hours is now being done in seconds.
See what’s buried in your patient charts.
Start with an inpatient Admit Note study, an outpatient HCC study, or run both in tandem.
And in a matter of weeks, you’ll have a documented and clinically adjudicated report with evidence behind every finding, ready for your leadership team to review.
No commitment, and administered transparently in the background with no disruption to your clinicians.